


説明
本アプリケーションノートでは、電解式傾斜センサーの生出力を度数に変換する方法について説明します。
チルトセンサのリニアレンジと動作範囲
An electrolytic tilt sensor’s measurement range can be described in two ways: linear range and operating range. The operating range is the range over which the sensor will give a monotonic output but otherwise has no defined characteristics (it is non-linear). The linear range is the portion of the operating range where the output is linear to within a certain percentage. Figure 1 shows the difference between the two ranges.


図1リニアレンジ(左)と動作範囲(右)。
線形近似
To find the tilt angle within the linear range, it is necessary to find a linear function that matches the output of the sensor. This will be the function of the line in the left graph in Figure 1. This function is given below:
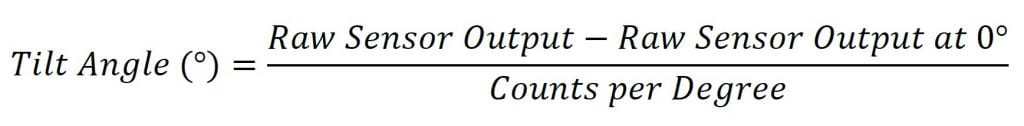
この式における生のセンサ出力は、センサの出力です。これは通常はカウント数ですが、センサー出力の読み方によっては他の単位を使用することができます。
他の2つの値は、特定の角度でセンサーのサンプルを取る必要があります。これらの角度は、別のセンサー、デジタル分度器、または角度を決定する他の方法を使用して決定することができます。0°での生のセンサー出力は、センサーが水平になったときの出力です。
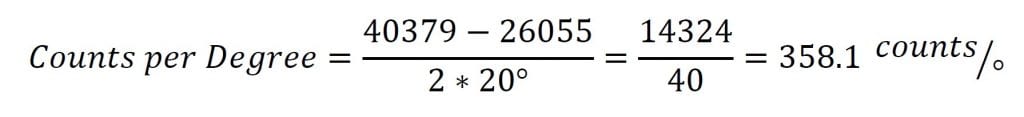
The counts per degree (which is the slope of the line) are calculated using the following formula:
![]()
The linear range is obtained from the datasheet for the sensor. The raw outputs will be the sensor output at the edges of the linear range. For example, for a sensor with a linear range of ±25°, the raw outputs would be sampled at +25° and -25°. Note that these samples will only need to be taken once to create the function; converting tilt can then be done using the sampled values.
Let’s say we have a 0717-4319-99 sensor with a 16-bit (0 to 65535) output we would like to convert to degrees. This is a dual axis sensor with a linear range of ±20°. Since it is a dual axis sensor, we will need 2 formulas: one for the X axis and one for the Y axis. First, we will find the X axis formula. We start be taking samples at 0° and ±20° and find the following measurements.
X軸傾斜(-20°時)=26055
X軸の傾き(0°時)=33234
X軸チルト(±20°時)=40379
これで、これらのサンプルを使って度数を計算できるようになりました。
The counts per degree and zero samples can then be plugged into the formula to give the conversion below:

Y軸測定が必要な場合は、Y軸からのサンプルを使用して、これらのステップに再度従ってください。
Now, whenever we have a measurement from this sensor we would like to convert to degrees, we can use this new formula.
For example, if we have an X output of 29655, we can use the formula to determine the tilt angle:
![]()
学位あたりの概算数
製造工程に起因する若干のばらつきがあるため、変換関数は特定のセンサごとに計算する必要があります。しかし、これは常に実行可能とは限りません。以下の表は、計算に使用できる度数と0°あたりの平均カウント値を示しています。これらの値を使用すると、特定のセンサ用の関数を作成するよりも精度の低い測定になることに注意してください。すべての値は 16 ビット (0-65535) 出力の場合の値です。表にないセンサの場合は、上記の手順で変換を見つける必要があります。
| センサー | 学位ごとのカウント数 | ゼロ度 |
| ApexTwo™ | 284 | 32768 |
| F203-00A-212-00 | 17582 | 32768 |
| F225-00T-003-01 | 976 | 32768 |
| 0703-0711-99 | 17582 | 32768 |
| 0703-1602-99 | 976 | 32768 |
| 0703-1603-99 | 976 | 32768 |
| 0717-4303-99 | 736 | 32768 |
| 0717-4304-99 | 268 | 32768 |
| 0717-4305-99 | 188 | 32768 |
| 0717-4306-99 | 188 | 32768 |
| 0717-4311-99 | 268 | 32768 |
| 0717-4313-99 | 342 | 32768 |
| 0717-4314-99 | 335 | 32768 |
| 0717-4316-99 | 756 | 32768 |
| 0717-4317-99 | 569 | 32768 |
| 0717-4318-99 | 284 | 32768 |
| 0717-4319-99 | 363 | 32768 |
| 0717-4321-99 | 758 | 32768 |
| 0717-4322-99 | 594 | 32768 |
| 0729-1751-99 | 284 | 32768 |
| 0729-1752-99 | 284 | 32768 |
| 0729-1753-99 | 284 | 32768 |
| 0729-1754-99 | 284 | 32768 |
| 0729-1755-99 | 284 | 32768 |
| 0729-1759-99 | 284 | 32768 |
| 0729-1760-99 | 284 | 32768 |
| 0729-1765-99 | 976 | 32768 |
| 0729-1767-99 | 284 | 32768 |
| 0729-1768-99 | 284 | 32768 |
| 0729-1769-99 | 284 | 32768 |
| 0737-0101-99 | 2887 | 32768 |
| 0737-1203-99 | 41942-57670 | 32768 |
多点補間
多点補間法は、事前に採取したサンプルを使用して度数単位の測定値を導き出します。この方法の精度はサンプルの数と分布に依存しますが、一般的には3つのサンプルを取っても線形近似よりも良い結果が得られます。
Sample distribution is one of the most important factors in reaching an accurate conversion. Conversions close to samples will be more accurate. Because of this, samples taken closer together will result in more accurate conversions. These samples should be taken across the entire range of the sensor. Depending on the application, they can be evenly dispersed evenly across the entire range or focused in one region where precision is necessary.
To convert a raw value to degrees, identify two reference samples. These are the two samples that are closest to the measurement in each direction. Then, find a linear approximation between the two samples and map the raw output onto this approximation. The point on this line will give the sensor’s tilt in degrees. The graph in Figure 2 shows a visualization of this concept.
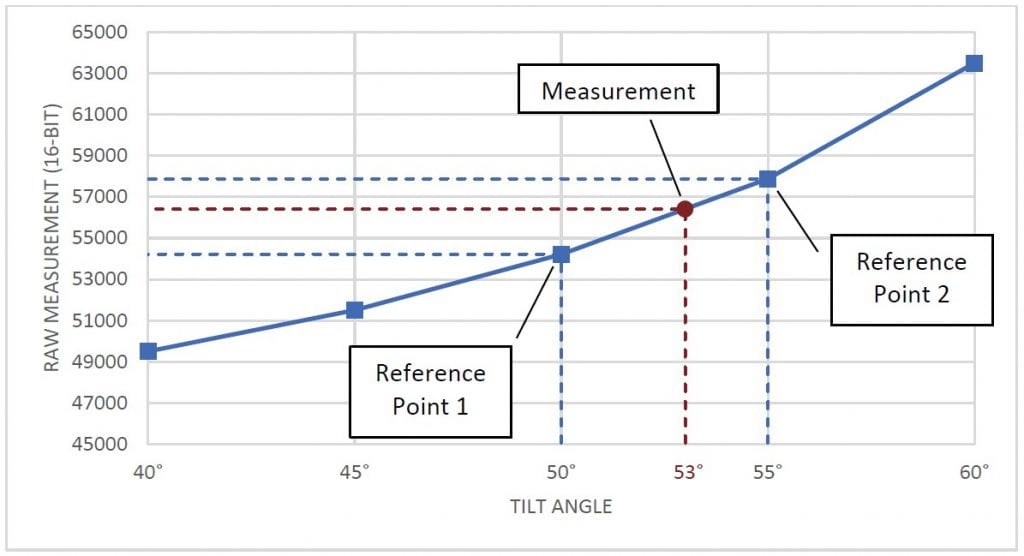
図2試料、基準試料、測定結果を表示したグラフ。
この換算式は以下の通りです。
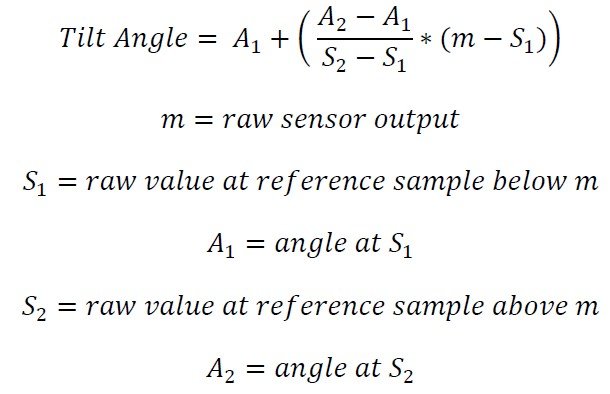
動作範囲が±60°の傾斜センサーから56412の生の測定値があるとします。また、変換に使用するために 5°間隔ですでにサンプルを採取したとします。56412 とサンプルを比較することで、2 つの基準点が 50°(54213)と 55°(57878)になることがわかります。次に、角度を計算するための公式を使用することができます。

したがって、最終的な測定は53°となります。
この方法は、センサの動作範囲内の任意の場所からの測定値を度数に変換するために使用することができます。また、線形近似よりも優れた精度が得られます。ただし、最良の結果を得るためには、多くの正確なサンプルが必要です。
多項式補間
多項式補間は、多くのサンプルを取らずに正確な測定を実現するために使用することができます。この方法では、サンプルを使用して、センサーの動作範囲にわたって正確な変換を提供する多項式を見つけます。
The samples taken will be used to develop a polynomial equation that will describe the sensor output. At a minimum, you will need N-1 samples to derive a degree N polynomial. For example, 7 samples will create a degree 6 polynomial. You can also use more samples to create a lower degree polynomial, but this will generally have lower accuracy than creating a
higher degree polynomial with the same points.
サンプルの数は問いませんが、少なくとも3つのサンプルを取ることをお勧めします。2つのサンプルを使用しても問題ありませんが、線形近似になります。次数7以上の多項式からは精度の向上はほとんどないことに注意してください。
While the polynomial can be determined manually, it is much easier to calculate it using software. One simple method is to use Microsoft Excel’s line of best fit; however, this will may not be precise enough for a usable conversion. Wolfram Alpha is a more accurate option, but the equation will still have to be solved manually. The best option is to use a programming library. For example, the Polynomial.fit() method from the NumPy Python library can be used. The code below shows how this can generate a 6th order polynomial from 7 points:
インポート numpy.polynomial.polynomial
係数 = numpy.polynomial.polynomial.Polynomial.fit(
[56668, 46553, 36140, 32845, 31207, 21913, 9586], # 生の値
60, 42, 12, 0, -6, -36, -60], # 生の値に対応する角度の値
6)# 多項式の次数
print(係数)
# # 出力。
# [-7.88427627e+01 2.57631617e-03 -7.711958174e-08 -1.75354175e-13
2.17551410e-16 -5.89635260e-21 4.45379575e-26] #2.17551410e-16
このような関数を使用する場合、次数を適切に指定することが重要であることに注意してください。例えば、4サンプルでは3次の多項式が生成されます。しかし、次数として4を指定すると、ライブラリはランダムに推測して式を作成します。その結果、正確な変換ができなくなってしまいます。
The array returned by Polynomial.fit() are the coefficients of the polynomial. Based on the output above, the equation
would be:
角度= (4.45e-26)x6- (5.89e-21)x5+ (2.17e-16)x4- (1.75e-13)x3- (7.72e-8)x2+ (2.57e-3)x1- 78.84
この関数を使って、xの生の値を差し込むことで未知の角度を解くことができます。例えば、上記の関数を使って、生の測定値が41643だとします。次のような計算で角度を求めることができます。
角度= (4.45e-26)(41643)6- (5.89e-21)(41643)5+ (2.17e-16)(41643)4- (1.75e-13)(41643)3- (7.72e-8)(41643)2+ (2.57e-3)(41643)1- 78.84
角度= 232.264 - 738.402 + 654.227 - 12.663 - 133.868 + 107.285 - 78.842 = 30.002°。
If using the NumPy library shown above, this can be done using the polyval() method.
print(numpy.polynomial.polyval(41643, coefficients.convert(.coef)))
# 出力30.001695321007
Note that the result of this calculation is very sensitive to any change in input. For example, if the coefficients above are rounded to 3 significant digits (as written), the result of the equation is 31°. Because of this, it is important not to round any values while calculating the angle with this method.